Nota
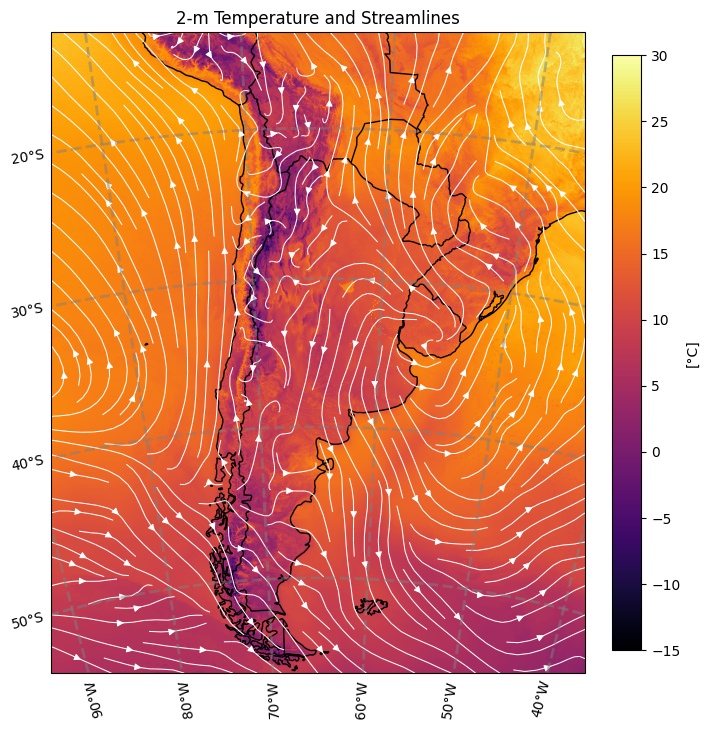
Campo de temperatura a 2m y líneas de corriente
(Última actualización 1 sep 2023)
Ejemplo para graficar un campo de temperatura a 2m y líneas de corriente.
Example to plot a 2-m temperatura and streamlines.
Video del tutorial:
Tutorial video:
Tutorial:
[ ]:
# En caso de utilizar Google Colab, descomentar las siguientes líneas
# In case of using Google Colab, uncomment the following lines

#!pip install --no-binary shapely shapely --force
#!pip install h5netcdf
#!pip install cartopy
#!pip install metpy
[ ]:
# Importamos las librerías necesarias
# We import the necessary libraries
import xarray as xr
import h5netcdf
import datetime
import cartopy.crs as ccrs
import cartopy.feature as cf
import matplotlib.pyplot as plt
import metpy.calc as mpcalc
Definimos la fecha y hora de inicialización del pronóstico:
We define the forecast initialization date:
[ ]:
init_year = 2022
init_month = 4
init_day = 1
init_hour = 0
INIT_DATE = datetime.datetime(init_year, init_month, init_day, init_hour)
Definimos el plazo de pronóstico a graficar:
We define the forecast lead time to plot:
[ ]:
lead_time = 12
Leemos el archivo:
We read the file:
[ ]:
# Descomentar la opción elegida:

# --------
# Opción 1: Para acceder al archivo online
# Option 1: To access the file online
#!pip install s3fs
#import s3fs
#s3_file = f'smn-ar-wrf/DATA/WRF/DET/{INIT_DATE:%Y/%m/%d/%H}/WRFDETAR_01H_{INIT_DATE:%Y%m%d_%H}_{lead_time:03d}.nc'
#fs = s3fs.S3FileSystem(anon=True)
#if fs.exists(s3_file):
#    f = fs.open(s3_file)
#    ds = xr.open_dataset(f, decode_coords = 'all', engine = 'h5netcdf')
#else:
#    print('El archivo buscado no existe')
# --------

# --------
# Opción 2: Para abrir un archivo ya descargado
# Option 2: To open an already downloaded file
#filename = '/content/drive/MyDrive/AWS/archivos_prueba/20220401_00/WRFDETAR_01H_{:%Y%m%d_%H}_{:03d}.nc'.format(INIT_DATE,lead_time)
#ds = xr.open_dataset(filename, decode_coords = 'all', engine = 'h5netcdf')
Calculamos las componentes zonal y meridional del viento a 10m:
We calculate the zonal and meridional components of 10-m wind:
[ ]:
u, v = mpcalc.wind_components(ds['magViento10'], ds['dirViento10'])

u = u.metpy.dequantify()
v = v.metpy.dequantify()
Generamos la figura:
We generate the plot:
[ ]:
# Seleccionamos la proyección de los datos
# We chose a map projection
projection = ccrs.LambertConformal(central_longitude = ds['Lambert_Conformal'].attrs['longitude_of_central_meridian'],
                                 central_latitude = ds['Lambert_Conformal'].attrs['latitude_of_projection_origin'],
                                 standard_parallels = ds['Lambert_Conformal'].attrs['standard_parallel'], cutoff = -5)

fig, ax = plt.subplots(1, 1, figsize = (7, 10), constrained_layout = True, subplot_kw = {'projection': projection})
ax.set_extent(extents=[-500*4000, 500*4000, -600*4000, 600*4000], crs = projection)
cs = ax.pcolormesh(ds['lon'], ds['lat'], ds['T2'][0, :, :], vmin = -15, vmax = 30, cmap = 'inferno', transform = ccrs.PlateCarree())
strm = ax.streamplot(ds['lon'].values, ds['lat'].values, u[0, :, :].values, v[0, :, :].values, density = [1.5, 1.5], color = 'white', linewidth = 0.75, transform = ccrs.PlateCarree())
ax.add_feature(cf.COASTLINE)
ax.add_feature(cf.BORDERS)
ax.set_title(f'2-m Temperature and Streamlines')
gl = ax.gridlines(crs = ccrs.PlateCarree(), draw_labels = True, x_inline = False,
                  linewidth = 2, color = 'gray', alpha = 0.5, linestyle = '--')
gl.top_labels = False
gl.right_labels = False
cbar = plt.colorbar(cs, shrink = 0.6)
cbar.set_label('[°C]', rotation=90)
plt.show()
/usr/local/lib/python3.10/dist-packages/cartopy/io/__init__.py:241: DownloadWarning: Downloading: https://naturalearth.s3.amazonaws.com/50m_physical/ne_50m_coastline.zip
  warnings.warn(f'Downloading: {url}', DownloadWarning)
/usr/local/lib/python3.10/dist-packages/cartopy/io/__init__.py:241: DownloadWarning: Downloading: https://naturalearth.s3.amazonaws.com/50m_cultural/ne_50m_admin_0_boundary_lines_land.zip
  warnings.warn(f'Downloading: {url}', DownloadWarning)